

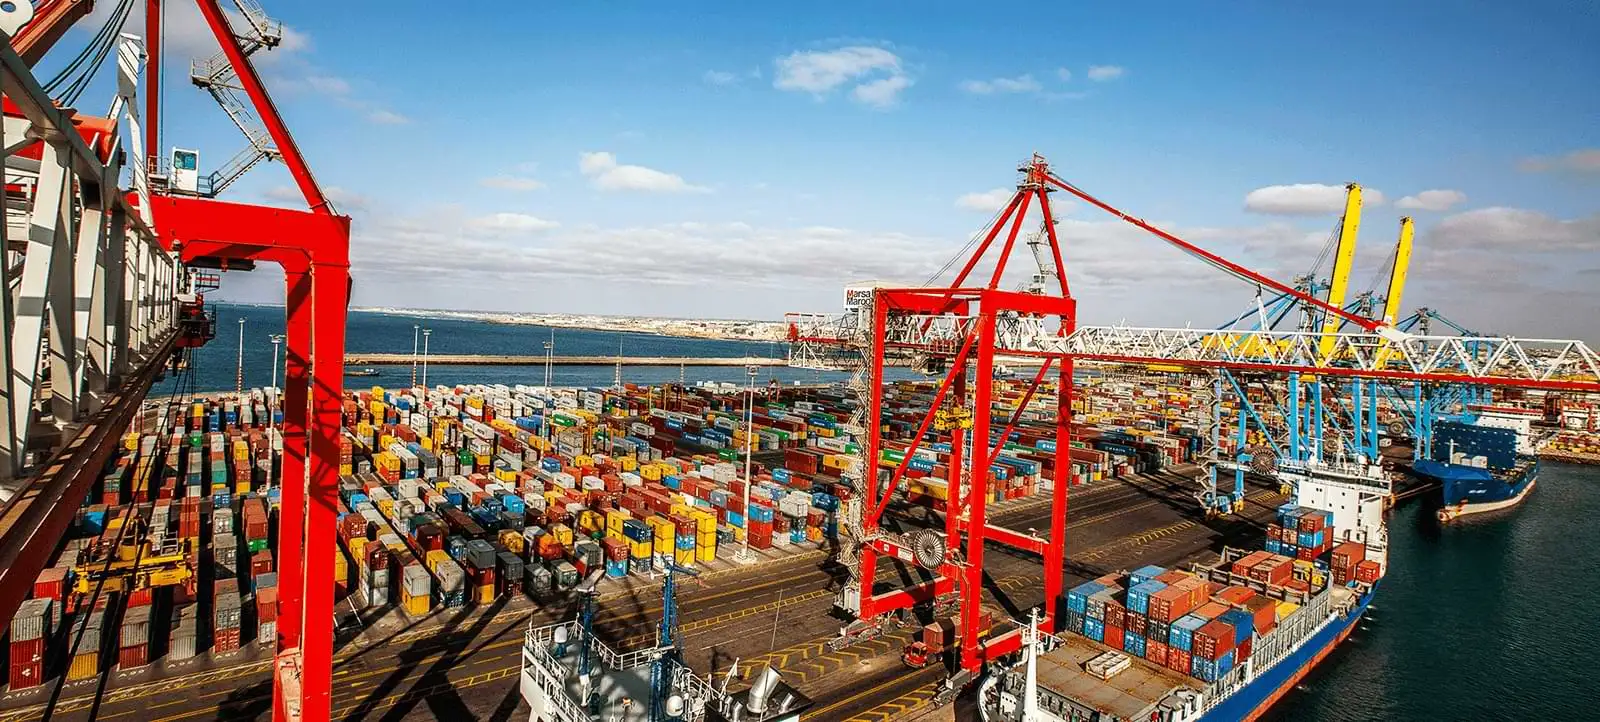
Tanger Med is no longer only Morocco’s flagship port. It is becoming the operating system through which Morocco converts geography, industrial zones and nearshoring into maritime leverage.
The 2025 numbers confirm the shift. Tanger Med handled 11,106,164 TEUs in 2025, up 8.4% year-on-year, and processed more than 161 million tons of cargo, up 13.3% from 2024. Valenciaport, one of Southern Europe’s major container gateways, closed 2025 with 5.66 million TEUs, up 3.41% year-on-year.
Tanger Med 2025 Market Signal
Container traffic: 11,106,164 TEUs
Container growth: +8.4% year-on-year
Cargo tonnage: more than 161 million tons
Cargo growth: +13.3% year-on-year
TIR truck traffic: 535,203 units
Passenger traffic: 3,220,422 passengers
Activity-zone business volume: $20.61 billion
Tanger Med’s activity zones generated $20.61 billion in business volume in 2025, while the group’s published key figures show 1,500 companies, 145,000 jobs created and 3,000 hectares of developed zones. That matters because the port is not scaling as a standalone transshipment facility; it is scaling as a port-industrial complex.
The high-alpha question is not whether Tanger Med is large. The market already knows that. The question is whether Tanger Med is structurally repricing Euro-African maritime trade by combining container scale, industrial-zone output, customs velocity and short-sea access into Europe.
The Disruption: Maritime Value Is Moving Toward Port-Industrial Platforms
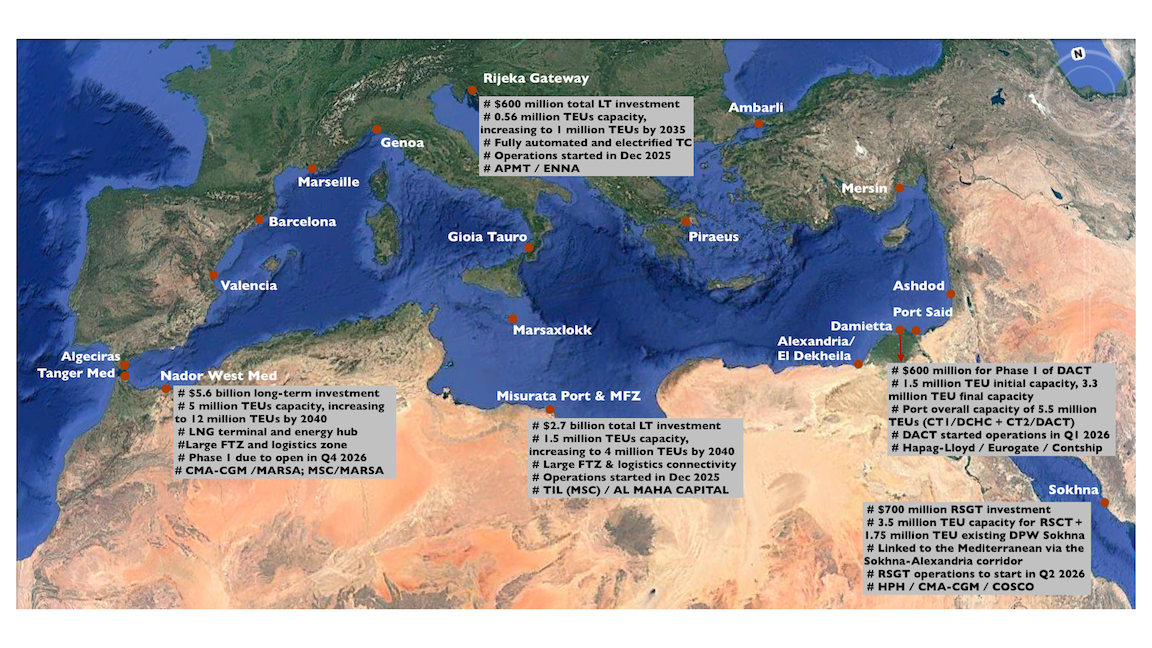
The western Mediterranean port map was historically read through Southern Europe: Algeciras, Valencia, Barcelona, Genoa and Marseille. Tanger Med has changed that logic by building a Moroccan platform directly at the Strait of Gibraltar, where Atlantic, Mediterranean, European and African shipping lanes converge.
The disruption is not container volume alone. It is the integration of port capacity with industrial zones, automotive production, agri-food exports, TIR truck flows, customs systems and short-sea connectivity to Europe. A traditional port competes on terminal performance; Tanger Med competes on the full factory-to-ship-to-Europe corridor.
Maritime value-chain map
Global shipping routes ──► Strait of Gibraltar crossing ──► Tanger Med container scale ──► Moroccan industrial zones ──► TIR truck flows ──► Short-sea Europe delivery ──► Southern Europe hub pressure
The commercial impact is direct. Tanger Med is not only moving cargo; it is compressing the distance between Moroccan production and European consumption.
Southern Europe’s New Competitive Spread
Valencia remains a major European port, but the container spread is now structurally visible. Valenciaport reported 5.66 million TEUs in 2025, a record year for the Spanish port, while Tanger Med crossed 11.1 million TEUs over the same period.
Container benchmark
Tanger Med 2025: 11.1 million TEUs
Valenciaport 2025: 5.66 million TEUs
Tanger Med growth: +8.4%
Valenciaport growth: +3.41%
Relative signal: Tanger Med is scaling faster from a much larger container base
This does not mean Tanger Med replaces Valencia or Algeciras across every lane. European hubs still benefit from deep inland demand, EU customs integration, mature rail networks and established logistics ecosystems. The sharper conclusion is that Tanger Med has inserted a high-growth Moroccan alternative into a maritime zone that once defaulted more naturally to Southern Europe.
Competitive-pressure map
Higher EU operating costs ──► Congestion and land scarcity ──► Manufacturing shift toward Morocco ──► Tanger Med export density ──► Carrier route optionality ──► Southern Europe margin pressure
The Gibraltar disruption is therefore not a symbolic ranking story. It is a route-economics story.
The Port-Industrial Model
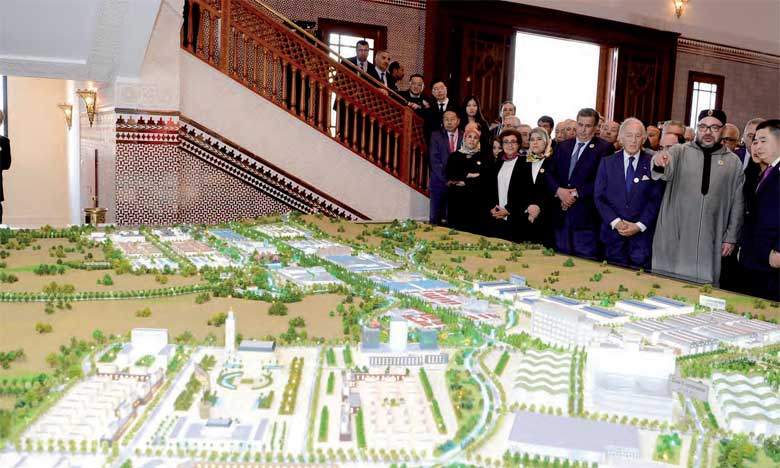
Tanger Med’s strongest advantage is the way it fuses port throughput with real-economy production. The port moves containers, vehicles, trucks, passengers and industrial exports through a system tied to Moroccan manufacturing and logistics zones.
TIR truck traffic reached 535,203 units in 2025, up 3.6% year-on-year, with growth driven by exports of industrial products and agri-food products. That is the real-economy signal hidden behind the port headline: truck flows reflect export movement from Morocco’s production base, not only transshipment volume.
Factory-to-Europe map
Moroccan factory output ──► Supplier park consolidation ──► Export documentation ──► TIR truck processing ──► Tanger Med terminal loading ──► Short-sea crossing ──► European distribution
This is why Tanger Med is more difficult to benchmark against pure port infrastructure. Its competitive strength comes from the industrial economy attached to the quay.
Cargo Mix: The Tension Beneath the Headline
Headline tonnage growth can hide product-mix tension. The real analytical question is how Tanger Med’s cargo base evolves across containers, TIR trucks, vehicles, hydrocarbons, bulk flows and passengers.
The 2025 vehicle data shows the point clearly. Tanger Med’s two vehicle terminals handled 526,862 vehicles in 2025, down from the previous year, reflecting changes in car production and the reconfiguration of global vehicle flows. That decline does not weaken the long-term port-industrial thesis; it shows why investors must read Tanger Med through mix quality, not only total cargo growth.
Cargo-mix tension
Total cargo growth ──► Strong headline signal
Vehicle flow decline ──► Product-mix rebalancing
TIR export growth ──► Real-economy resilience
Industrial-zone output ──► Structural demand anchor
Investor test ──► Diversification beyond one cargo category
The port’s strength is not that every category rises every year. The strength is that multiple demand channels can offset category-level volatility.
Automotive: Still Strategic, No Longer a Lazy Growth Assumption
Automotive remains central to the Tanger Med thesis, but 2025 data requires a sharper reading. The vehicle terminals handled 526,862 vehicles in 2025, a decline linked to production adjustments and shifts in global car flows.
That is not a reason to abandon the automotive thesis. It is a reason to treat it as an execution variable. Morocco’s automotive corridor remains strategic because it connects OEM production, supplier depth, port logistics and European demand. But the sector is exposed to model cycles, EV transition timing, European demand shifts and OEM sourcing decisions.
Automotive corridor map
OEM production ──► Supplier localisation ──► Vehicle terminal allocation ──► European short-sea export ──► Dealer network delivery ──► Port volume resilience
Tanger Med’s automotive value will be determined by the next production cycle, not by a single-year vehicle count. The investor test is whether Morocco’s industrial expansion converts into higher recurring terminal flows once OEM adjustments stabilise.
The Nearshoring Flywheel
Tanger Med’s long-term advantage sits in nearshoring. European manufacturers are under pressure to shorten supply chains, reduce exposure to Asia-linked disruption, cut logistics lead times and manage cost inflation. Morocco offers a lower-cost production base close to European markets, with Tanger Med as the export valve.
Nearshoring flywheel
European cost pressure ──► Morocco production allocation ──► Supplier localisation ──► Tanger Med export flows ──► Faster Europe delivery ──► Higher OEM confidence ──► More industrial capex
The flywheel only works if all links move together. Industrial zones must attract suppliers, customs must remain fast, port terminals must avoid congestion, and shipping lines must maintain reliable schedules. Tanger Med’s advantage is not geography alone; it is the ability to make geography operational.
The Gibraltar Advantage
The Strait of Gibraltar gives Tanger Med physical relevance. Infrastructure gives it commercial relevance.
The port sits at the intersection of Atlantic and Mediterranean flows, but that position only becomes market power when paired with terminal capacity, logistics zones, customs processing, industrial output and short-sea links into Europe.
Gibraltar operating chain
Atlantic route access ──► Mediterranean crossing ──► Tanger Med transshipment ──► Industrial-zone cargo ──► TIR truck processing ──► Europe-facing distribution
This is the difference between being located near a shipping lane and converting that location into a logistics franchise.
Customs Velocity and TIR Discipline
Logistics markets reward certainty. A port can be large and still lose value if customs processing, dwell time, truck flows or documentation create uncertainty.
Tanger Med’s TIR traffic growth is therefore a critical operating signal. It shows that the port is moving real export flows through truck-based Europe-facing corridors, not only handling containers at sea. The institutional test is whether truck processing remains fast as volume rises.
Processing-velocity map
Factory dispatch ──► Export clearance ──► Truck gate entry ──► Customs processing ──► Terminal coordination ──► Vessel loading ──► European arrival
Scale without velocity creates congestion. Scale with velocity creates pricing power.
Activity Zones: The Balance-Sheet Layer Behind the Port
The $20.61 billion business volume generated by Tanger Med’s activity zones is the strongest evidence that the port is attached to a real economic base. A container hub can grow through transshipment. A port-industrial platform grows through companies, jobs, exports and recurring logistics flows.
Activity-zone conversion map
Industrial tenants ──► Production output ──► Export cargo ──► Port throughput ──► Logistics services ──► Business volume ──► Investor confidence
That layer is what Southern European ports cannot easily replicate. They may have deeper inland markets, but they do not control Morocco’s manufacturing cost base or export policy environment.
Investor Takeaway
Tanger Med has moved from port growth into maritime-industrial repricing.
Investment implications
Tanger Med now operates at a container scale far above Valencia’s 2025 benchmark.
Activity-zone output proves the port is tied to industrial production, not only transshipment.
TIR truck growth confirms real-economy export flows into Europe.
Automotive remains strategic, but 2025 vehicle contraction requires mix-sensitive analysis.
Nearshoring strengthens the factory-to-Europe corridor.
Customs velocity and terminal performance are the key operational moat.
Southern European hubs face cost, congestion and land constraints, but retain inland-market depth.
The investor question is not whether Tanger Med is bigger than specific European ports. It is whether its integrated model keeps converting Moroccan industrial output into faster, cheaper and more reliable Euro-African trade flows.
MMO Strategic Scorecard: Tanger Med Gibraltar Disruption
Strategic Vector: TEU Scale
Current Market Signal: 11.1 million TEUs in 2025; +8.4%.
Institutional Execution Test: Sustaining volume growth without terminal congestion.
Strategic Vector: Cargo Depth
Current Market Signal: 161 million tons in 2025; +13.3%.
Institutional Execution Test: Diversifying tonnage beyond single-category exposure.
Strategic Vector: Europe Spread
Current Market Signal: Valencia at 5.66 million TEUs in 2025.
Institutional Execution Test: Maintaining scale advantage against Southern Europe.
Strategic Vector: Zone Output
Current Market Signal: $20.61 billion activity-zone business volume.
Institutional Execution Test: Converting industrial activity into recurring port flows.
Strategic Vector: TIR Velocity
Current Market Signal: 535,203 TIR trucks in 2025; +3.6%.
Institutional Execution Test: Preserving customs speed under higher export volume.
Strategic Vector: Auto Mix
Current Market Signal: 526,862 vehicles handled in 2025.
Institutional Execution Test: Recovering vehicle flows as OEM production cycles adjust.
Strategic Vector: Gibraltar Edge
Current Market Signal: Direct Atlantic-Mediterranean-Europe-Africa position.
Institutional Execution Test: Turning location into reliable delivery-time advantage.
What Investors Must Watch Next
1. TEU spread versus Valencia and Algeciras
Track whether Tanger Med continues widening its volume advantage in 2026–2027 while avoiding terminal congestion.
2. Vehicle-terminal recovery
Monitor whether 2025’s automotive decline reverses as Moroccan production cycles and European demand stabilise.
3. TIR and customs velocity
Watch whether truck growth remains positive without dwell-time pressure, processing delays or customs bottlenecks.
Final Outlook
Tanger Med has altered the western Mediterranean port equation.
Its 2025 numbers show more than scale. They show a Moroccan port-industrial platform combining container throughput, industrial-zone output, TIR truck flows, short-sea access and nearshoring into one operating system.
The disruption is not that Southern Europe disappears. Valencia, Algeciras and other European hubs remain important. The disruption is that Tanger Med now forces them to compete against a Moroccan platform that combines port scale with lower-cost industrial production and direct Europe-facing export routes.
The opportunity is significant. If Morocco deepens industrial output, preserves customs velocity and restores automotive growth, Tanger Med becomes the maritime backbone of a North African manufacturing corridor.
The risk is operational. Terminal congestion, vehicle-flow volatility, customs delays or weak industrial follow-through could slow the flywheel.
For now, the market signal is clear.
Tanger Med is no longer simply participating in Euro-African maritime trade.
It is repricing it.
Executive Engagement
Are you operating in shipping, logistics, automotive, nearshoring, port infrastructure, customs, freight forwarding, industrial real estate or Euro-African trade?
MMO is tracking how Tanger Med is reshaping maritime flows between Morocco, Europe and Africa.
Share your operational insights with our editorial team or contact us with data on TEU flows, TIR processing, automotive logistics, customs velocity, freight costs or nearshoring demand.